Facebook Changes: New, Improved Facebook Insights
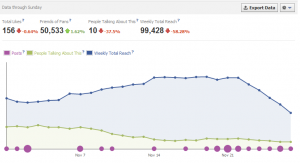
 There’s a lot of new terminology here and it can be somewhat confusing (even after reading Facebook’s explanations they give when you hover over the little “?” icon). Here’s a run-down of what the new insights mean for you. Also, it’s important to note that the graph represents the most recent data for a month.
- Total Likes: This is the number of likes your page has. This has not changed.
- Friends of Fans: This is the combined number of friends that your fan base has and does not include the number of fans. This can help you understand how many people your message can possibly reach. It probably won’t reach all those friends due to the way that Facebook Edgerank works, but this is an important stat to note.
- People Talking About This: This stat is comprised of the number of times that someone creates a “story” about your page. A “Story” (a new term coined by Facebook) is basically anything that someone can do while interacting with your page. If a person “likes” your page or post, comments, posts a pictures, shares your post, etc. it will generate a “story”. When people generate stories this gives their friends the possibility of seeing it in their own newsfeeds and gives them the chance to interact with it as well. This stat is a weekly stat. I’m not sure why they mix weekly stats with a monthly graph, but at least now you know. Also, you can export the stats to see the whole month’s info, but it doesn’t come with a nice pretty graph.
- Weekly Total Reach: This is the number of people who “saw” your post either on their own newsfeed or on your Facebook page. “Saw” is defined by Facebook as being on their screen. Whether they actually read it or not is not taken into account. Also, this number includes any ads or sponsored stories that have been running. Once again, this is only a weekly stat.
- Those Purple dots: Facebook has begun adding purple dots to the chart to show when you actually posted to the page. If there’s a purple dot for that date, it means
 you’ve posted that day and the size of the dot represents the number of posts per day. You can “hover” over the dot with your mouse to see the number of times you’ve posted that day. Use this stat (in conjunction with your “People Talking About This” stat) to determine whether you should be posting more or not. If you’re only posting once a day and your engagement levels are low, then try experimenting with posting multiple times a day. If the “People Talking About This” goes up, then you can get more engagement from posting multiple times a day.
Hi, I’m Cassie. I love books and media and think that they have the power to change our lives. I also love to write, play games like Minecraft and ARK, cook, run, and dance. For a living, I provide Digital Marketing and Website Design services under the company I founded Team 3 Media. Currently, I’m working on writing more, learning to bake better bread, and staying consistent with my health and fitness goals.
